
This message from Peter got eaten by the "too big" fairy the first time around -- Craig -- Thanks for your many insightful comments Perry.
What signal is it dying with?
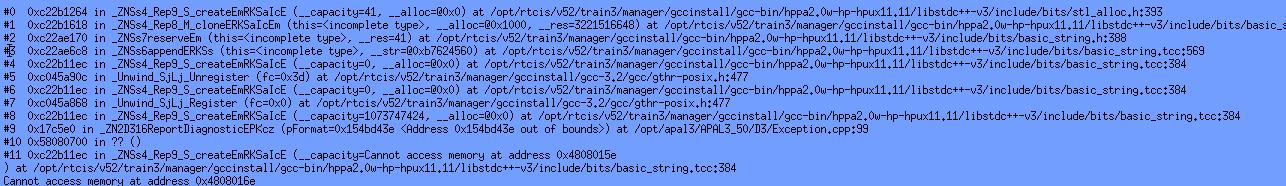
The message I get is: Program exited with signal 11 (Segmentation Fault) However, from the attached stack frame you can see that erros occur inside stl code. In this particular case, it all has to do with simple std::string manipulations which require resizing the strings internal buffer. However, the error can also occur at entirely different locations. Also, I'm really puzzled why I only see 11 frames on the stack for this thread. What the code actually does is call a method of class ExceptionContext to write a message to a log file (the method behaves basically like sprintf). The following code reflects somehow what the code might have been doing at the time of the crash (error occurs at gEC.ReportDiagnostic()): #include "Exception.h" ExceptionContext gEC("mylogfile.log"); void foo() { std::string strDB = "Database"; std::string strTbl = "Table"; std::string strK1 = "12"; std::string strK2 = "A92bit12"; std::string strK3 = "901-12"; gEC.ReportDignostic("Table %s has key %s", (std::string("[") + strDB + "." + strTbl + "]").c_str(), (std::string("[") + strK1 + "/" + strK2 + "/" + strK3 + "]").c_str()); } Clearly, there are more frames on the stack, but I simply don't understand how to get the complete picture. But don't be fooled by this stack trace; a fact is that the error is everytime totally different and only occurs under HP-UX.
Linux has a great program called "valgrind" that can be used for debugging memory and threading issues. If you can get it to compile under Linux on x86 I'd **highly** recommend you run valgrind on your program.
I will most definitively try this one out. Pete